https://twitter.com/typesfast/status/1536043269217341440
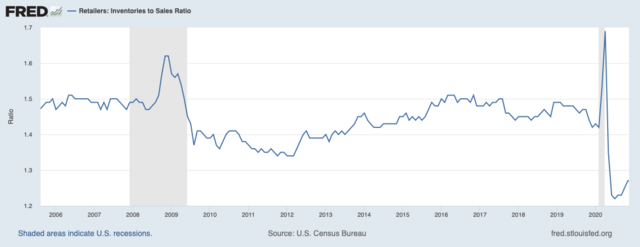
YoY inventory growth doesn't really provide much insight into inventory bloat, especially when inventory was out of whack in 2021. A better metric from
the original article - inventory-to-sales ratio is still historically low despite the recent uptick. (Though one category - "other merchandise" seems like a big, negative outlier.)
However I would like to see a metric that better tracks excess inventory by what each retailer considers excess compared to overall inventory, let's call it "excess inventory ratio". A chart based on trailing 4/8 weeks sales and another for projected 4/8 weeks would give a lot clearer picture of how things stand right now.
